Saturday, January 16, 2016

Fertilizer Worth Dying For

Nitrogen fertilizer used to be really hard to come by.  If farmers needed to fertilize their fields with N they basically had two options: Plant legumes which use bacteria to elegantly pull nitrogen out of the air or apply manure. While these were important strategies, yields were often still held back by low levels of nitrogen.  This all changed in 1909 but that's a story for a different post.

As farmers recognized, manure was an important source of nutrients for their fields and bird manure, or gunao, was no exception.  The word guano comes from the Quecha for fertilizer or manure, wanu. Bird guano was an even more potent source of soil nutrients than the manure European farmers were used to, with NPK up to 16-12-3.  That's pretty high, cow manure has an NPK more like .75-.25-.5. In a world where everyone wanted nitrogen for their farms (and gun powder), bird guano was a valuable commodity.

So imagine finding literal mountains of the stuff.  That's what you get when you have thousands upon thousands of birds excreting their meals of seafood onto islands which receive little rainfall.  (If you want to see what that many birds looks like, check out this gallery or here).  The Chinchas Islands off the coast of Peru were one such island, with mounds of precious precious guano layered 150 feet deep.


Above, you can see the Islas Chinchas and a whole lotta guano.  The mountains of precious poop were excavated and loaded onto waiting ships.  These pictures from the 1860s show that the Islas Chinchas were quite busy extracting the guano and shipping it out to Europe and the Americas.  Fortunes were made (NYSE: GRA, Tyntesfield) and Peru started raking in the dough.  So much dough that around the time these pictures were taken, the guano trade made up almost 60% of Peruvian government income.


More money more problems though.  Spain had never recognized Peru's independence in 1821 and was looking to reassert some level of dominance in the 1860s. After some financial and diplomatic bullying on the part of Spain that Peru did not submit to, Spain occupied the Chincha Islands in 1864, recognizing their economic value.  This was the opening act of the Chincha Islands War of 1864-1866 in which Chile, Ecuador, Boliva and Peru all allied against their former colonial master.  Despite naval superiority, Spain had no invasion force to land and nowhere to resupply.  The two year conflict ended when Spain pulled its forces out of the Pacific back to Europe by way of the Phillipines.

While the guano islands off the coast of South America was some fertilizer worth fighting over, the Chincha Islands War was a relatively small engagement.  The fighting over the nitrogen found in the Atacama desert would be a different story.


The Atacama desert is the driest desert on earth.  Scientists think the region has received no significant rainfall between 1570 and 1971 and that it has been extremely arid for around 200 million years.  This lack of rainfall created a region rich in Sodium nitrate, known also as Chilean saltpeter.  Potassium nitrate was also found in abundance. Miners started exploiting these reserves in the 1820s and soon the region would come to dominate the world market for nitrogen fertilizer for the next century. (More fortunes would be made here as well)

Many Chilean miners worked in the saltpeter mines despite much of the Atacama desert being located on Peruvian and Bolivian territory.  The Chilean owned Antofagasta Nitrate and Railway Company had an especially large stake in the region.  Bolivia had agreed in 1874 not to increase taxes on Chilean interests for 25 years, but in 1878 the Bolivian government imposed higher taxes on the Antofagasta company which were retroactive to 1874.  The company balked and so Bolivia moved to seize the company's assets. In response the Chilean army crossed the border and occupied the Bolivian port city of Antofagasta in the southern Atacama desert.

Needless to say, at this point tensions were running high.  15 days after occupation of Antofagasta by Chilean forces, Bolivia declared war. Peru, bound by a secret alliance treaty with Bolivia, declared war on Chile little more than a month later.  The War of the Pacific was a bloody conflict that would drag on for four years and ultimately deprive Bolivia of any access to the Pacific Ocean.  The area outlined in black below is the territory that victorious Chile took from both Bolivia and Peru in the conflict


Most historians have argued that the desire to control the vast nitrate deposits of the Atacama (as well as some guano rich islands) was the underlying cause of the war.  Bolivia to this day pressures the Chilean government to allow it a sovereign access point to the Pacific Ocean although with little effect. The saltpeter mines would be an important part of Chile's economy until the 1940s when synthetic nitrogen production made mining the Atacama for Sodium nitrate less profitable. 
Check out these Chilean archives for more great nitrate fertilizer posters.
It's easy to forget that all of this bloodshed was because people wanted to give their crops a little more nitrogen.  The important role that soil nitrogen plays in crop yield means that nitrogen fertilizer was critically important to agriculture and humanity. Agriculture's dependence on nitrogen fertilizer continues to this day. Currently the world uses 100 teragrams, or 100,000,000,000 kilograms of nitrogen fertilizer every year.  Without this annual addition of nitrogen to the worlds soils, our current agricultural system would collapse.  This Greek man sums up the situation quite nicely as he dumps a sack of Chilean nitrate all over the world.  


Thursday, January 7, 2016

Dumps of the world

We'll travel to three far-flung dumps in this post.  While we're at each dump we'll take quick look at the issues around diverting organic waste.  Our first visit will be the Central Landfill in Sonoma County where we'll have a brief requiem for the Sonoma Compost Company.  Then, figure out where you put your passport because we're headed to Beirut to take in the political turmoil brought on by the closure of the city's main dump, Naameh.  Lastly we'll walk through Mbeusbeuss, the massive landfill on the outskirts of Dakar that makes the Central Landfill in Sonoma feel like a nature preserve.

Central Landfill


The Sonoma Compost Company had operated atop the Central Landfill in Sonoma for 30 years, diverting Sonoma county's organic waste from landfills and turning it into valuable compost. The landfill portion of the Central Landfill opened in 1972, closed in 2005 over water contamination issues and reopened in 2010 after infrastructure repairs.  You'll notice in the map the windrows of the compost operation on the top left as well as the small subdivision (about 80% of it is visible in the photo) of Happy Acres in what is otherwise an agricultural area.  To make a long story short, a group of Happy Acres residents had been attempting to close the Sonoma Compost Company for years, many having moved into their subdivision knowing full well that there was an existing landfill located near by.  Eventually they landed on a clean water act lawsuit which got some traction.  During heavy rains, the compost company's 2 million gallon storm water collection pond overflowed twice, allowing water which had passed through compost to flow down towards Stemple Creek.  It seemed a deal might be reached with regulators to keep the compost operations open with the construction of an additional 3 million gallon storm water collection pond.  However Happy Valley residents, wary of the facility staying open, tried to halt construction of the additional pond with claims that this was potential habitat for the California Tiger Salamander. 

Another wrinkle in the story is that Republic Services took over control of the Central Landfill on April 1st 2015 in a 25 year contract with the county.  Previously the landfill had been run by the county with the Sonoma Compost Company operating as a tenant.  Given the sue happy neighbors, the deal included a clause which shifted all financial liability of the compost operation over to the Sonoma County Waste Management Agency.  The bottom line in all this is that once Republic controlled the landfill, the decision about whether to build the pond or not was in Republic's court. 

In order to build the pond on the landfill, Republic's permit would require some modifications. Despite the agreement that the county waste authority would be on the hook for current and future lawsuits, Republic was weary that this permit change could drag it into the ongoing Happy Acres legal battle and decided against the additional storm water collection pond.  In an interesting snippet from the Press Democrat, Rick Downey, division manager for Republic discussed the potential conflict of interest the company had:

"Downey acknowledged that the 25-acre compost area atop the landfill is prime space for his company to use to fill with garbage someday, but he denied that was part of the company’s decision-making in deciding not to allow the permit to be reopened to include the wastewater pond."

There is talk of a new composting facility being sited nearby or just to the west of the existing landfill, but for now organic waste is trucked out to composting facilities outside of Sonoma County. Costs have risen substantially for the disposal of organic waste and there's a lot more CO2 being put into the air by having to truck material so far out of the county.

If Republic had the contract for composting Sonoma County's organic waste instead of Sonoma Compost Company I have to imagine the construction of the additional storm water retention pond would have happened and composting would have continued in Sonoma County.  When governments hand over the operation of public resources to private entities though, those resources are understandably used for best interest of the private entity (within the terms of the contract of course). The best interest of the private entity may not always match up exactly with the best interest of the public.

Naameh


The Naameh landfill set in the hills to the south of Beirut.  This photo is looking north and you can see the terraces on the hillside in the far left at the bottom left of the dump in the picture below.


What are these people protesting?  Poor waste management policies that's what.  Beirut had been sending its waste to the Naameh landfill south of the city since 1997.  The landfill was only meant to be a temporary solution until a more permanent dump site could be found. It's closure had been planned and postponed several times since 1997. By July 2015 the final closure date of the dump had arrived and the government still didn't know where it was going to send Beirut's trash.  In the end, Naameh was meant to only hold 2 million tons of trash, but by 2015 it had taken in 15 million tons.   After the official closure date, residents of Naameh blockaded roads to ensure no more trash entered the dump located there.

The government had offered a new contract for hauling the garbage but required the contractor secure a new dump site - not an easy task considering the government had failed to find a new site for years.  Given the onerous requirement of coming up with a new dump site, there were no bidders for the contract to haul Beirut's waste. When Naameh closed, the contract with the current hauler Sukleen ended and then the trash simply stopped being collected.  The result?  Rotting piles of trash in the streets and protests over government inaction.


The roots of this crisis lay in Lebanon's ineffective government which is divided along sectarian lines.  It's not like this problem happened over night seeing as how Naameh was only meant to be open until the early 2000s and the final closure date in 2015 was known for some time.  Clearly, the government should have been doing something to address this problem but was incapabale.

Could composting have prevented this huge smelly headache for the government and the people of Beirut?  Definitely.  For starters, the whole reason the trash smells is because there is compostable material decomposing anaerobically.  Remove the compostable material and you have a bunch of stable plastics and other waste which won't smell.  That alone would be a victory.  More importantly though by diverting organic materials from landfills, Beirut could have kept Naameh open closer to 2030.

Currently about 50% of the solid waste produced in Lebanon is organic waste.  Of this, 9% is composted, which is actually an impressive amount.  However some rough math tells us that if all of the organic material going to Naameh was diverted and turned into compost, the government would have only filled it with 6 million tons of garbage or so instead of 15 million tons at this point.  Unfortunately the costs associated with composting in Lebanon are high, the demand for compost is low, the incoming materials are heavily contaminated, and so it is difficult to cover the high operation costs of composting.

Recently the government announced it had reached an agreement with a foreign contractor to remove all the trash from the streets of Beirut and all subsequently produced waste.  The waste will then be transported to another, as of yet undisclosed country.  The cost of this contract is surely staggering.  It seems safe to assume that the increased cost saving space in the Naameh by composting would have been cheaper than whatever Beirut will have to pay to haul trash to another country entirely.


Some interesting articles about the state of composting in Beirut:

Green Jobs Assessment in Lebanon

To Compost or to ??? An Overview from Lebanon


Mbeusbeuss


Two satellite photos of Mbeusbeuss.  You can see the massive mountains of trash rippling outward into the surrounding marsh and farm lands.


The sprawling dump of Mbeusbeuss handles all the waste for the city of Dakar.  It is in fact the westernmost dump of all the old world. The huge piles are sometimes burned sending massive black clouds hundreds of feet into the air.  I had some impressive photos of this but my camera walked off with somebody before I could upload them.  We were working about 3 km south of the dump and when the wind shifted in our direction it brought the most terrible, acrid, irritating smoke from the dump fires.  I can only imagine how bad it was at the dump itself.

Mbeusbuess is also home to well over a thousand souls who ply the trash looking for anything they can sell.  Along the roads inside the dump there are aggregaters who amass various items people have scavenged - glass bottles, woven nylon bags, metal, sandals etc. Within what seemed to be total anarchy there was a rudimentary system that had sprung up to sort through the incoming waste.


Residents of the dump use metal rods to pick through the trash spread about the dump.  The best items though are found in trash that nobody has scavenged yet.  When a truck arrives at the dump, people crowd around to be the first to pick through the fresh waste.


Among the various items scavenged for reuse at the dump was food waste.  This would be sold as feed for livestock.

If the costs for large scale composting are a challenge in Beirut, they are prohibitive in Senegal.  There was in fact an industrial scale composting facility for Dakar at one point:

Two industrial composting plants operated in Dakar, Senegal and Abidjan, CÔte d'Ivoire during the 1970s. These were financially unsuccessful, plagued by mechanical problems, and ultimately closed. - UN Environment Program

The problem with composting in a place like Dakar is that the infrastructure of a large composting facility is difficult to achieve and maintain.  If composting is to succeed in Dakar, it will probably have to be in decentralized locations and human scale without an extremely high level of mechanization.  Some estimates put the organic content of solid waste in Africa at around 70%.   Mbeusbeuss has wrought an enormous amount of pollution on waterways around it, sent toxic smoke into the lungs of surrounding residents and has literally swallowed up farm land in the neighboring communities.  Sadibou for example, who is pictured in an earlier post hilling up beds of rice, lost his family's plot of farm land when the dump overran it.  If 70% of the waste that has gone to Mbeusbeuss could have instead been composted and turned into a valuable resource, the size and harm of Mbeuss would be dramatically smaller.

Your own personal dump

Next time you're about to throw out an apple core stop and think where it's going.  Is it going out to a landfill or is it headed off to a composting facility.  Hopefully it's the latter but either way there is a complex system in place to take it off your hands and working hard to serve you, the waste producer.  (If you're composting it yourself it's actually a very simple and environmentally friendly system!)

Across all three of these dumps we've seen that the management of our solid waste and compost involves a massive amount of coordination on the part of government.  Even at Mbeusbeuss, fleets of garbage trucks must be coordinated to go out on different routes through the city of Dakar.  Waste management often ends up as a low priority for governments and this can end disastrously as with the crisis in Beirut.

Government inaction or the shifting of government responsibilities to private entities has been an issue with all three of these dumps.  At the Central Landfill in Sonoma County, the water retention pond required to continue operations at the facility might have been built had the landfill been operated the local government rather than a private company who had no real interest in whether the Sonoma Compost Company stayed open or not.  In Beirut, government inaction meant a new landfill site had not been found by the time the current dump of Naameh had to shut down.  A request for bids for the Beirut trash hauling and landfill contract went unanswered, highlighting that this was really a problem for government to solve, not private business. With the general lack of planning at Mbeusbeuss, the dump seems set to continue it's slow crawl over the surrounding communities despite talks of the necessity of closing it.

If for some reason you have managed to read this far, I think you'll agree that managing our waste requires serious long term planning.  Private enterprise can and certainly will be involved in this process.  Ultimately though, it will fall to governments to ensure that proper waste management plans are formulated and implemented.  Composting and the diversion of organic materials from landfills should be important considerations in these plans.  The repercussions of failure to adequately prepare for our waste streams aren't pretty (although they are smelly).  On the other hand, with proper planning, much of the waste we currently throw away can be turned into a valubale resource which can help combat climate change: compost.


Sunday, July 5, 2015

A Tale of Two Soils


With the masterful craftsmanship of one Scott Chenoweth, we now have a window into the world beneath our feet. The root window is a thin wooden planter box with one side made up of clear plexiglass.  The planter is divided into two sections so that two different soil treatments can be compared side by side.  Below you can see radish roots growing behind the plexiglass panel.  


The radish in the above picture were grown in very rich soil. Looking to make the most fertile growing medium possible, I created a mixture of compost, worm castings and some soil from my veggie beds.  In the other compartment of the planter I used the poorest bagged soil product I could find.  This "Top Soil Plus" product was just what I was looking for.  Its only two ingredients are sandy loam and forest humus.  I know that the sandy loam almost certainly came from a loam pit, a place where deposits of sandy soil are mined.  This material would be devoid of plant life and extremely low in soil biology.  I suspect the second material, the "forest humus" they are talking about here is some sort of byproduct from the logging industry.  It looked like very fine wood particles, not really humus.  The fact that the bag instructs gardeners to "use where needed to fill in low spots in lawns and gardens," makes it sounds like the company doesn't have many illusions as to the usefulness and fertility of this product.
Radish were planted in the two different soils at exactly the same time.  The same seed was used and the same amount of water applied to each side.  The difference between the radishes in the two soils was striking both above ground and below ground.  To the rigt you can see how few visible roots there are in the poor soil compared to the first photo taken of the rich soil.  These two photos were taken at the same time, each photo is of right below the soil line.


After the radish had set seed the soil was removed from the root window and put onto a board with screws to hold the roots in place.  The soil was then washed away so that only the large roots would remain behind.  One thing that is interesting to note is that the poor top soil product washed away with ease.  The fertile soil high in organic matter on the other hand was an enormous pain to wash away.  There were so many roots that it was a single spongy mass. Water would flow through without taking away much soil.  I had to blast the fertile soil at point blank range with extremely high pressure and even then it took quite a while to get it to wash away.

You can see in the picture below that the radish in the poor soil on the left grew spindly stalks, did not develop large edible portions, and formed very thin roots.  The radish on the right however grew thick edible portions, large networks of roots, and thick stalks with dark green leaves.


This picture below shows how the radish on the right have much darker green leaves than the radish on the left, most probably because of higher levels of plant available nitrogen in the fertile soil on the right.  I don't think the radish on the left in the poor soil would have gotten anywhere near as big as they did had I not given both sides a few doses of animal urine.  It felt like as soon as I applied the diluted urine the radish on the left immediately responded with a growth spurt.  Not very scientific to muddle with the experiment like that but I was curious to see if anything would happen.


Below you can see how the roots grew over time in the two windows.  The fertile soil is first and the poor soil is below.  (Unfortunately the animation starts as soon as the file loads on your browser so they usually aren't synced). You'll probably be able to notice the three week gap when I was slammed at work and neglected to take any pictures. This is when the roots fatten up instantaneously.


Here are some slower versions of the same animation.  Below is the radish in the poor soil.


And here is the radish in the fertile soil.  


One thing the surprised me was just how quickly the tap root on the radish reached the very bottom of the root window.  Within one week of the root starting to noticeably elongate it was already at the bottom of the two foot deep window.  Clearly if given the chance the roots would have gone down much deeper.  In Root Development of Vegetable Crops by Weaver and Bruner, the variety of radish they examined grew roots down to 7 feet deep.

Monday, May 18, 2015

Salting the Earth

Everyone loves a good mystery, so here's a soil whodunnit for you.  I was outside one day when I noticed a large bare spot in the weed lawn.  Only a few dock (Rumex sp) were managing to make a go of it.


You can see that the dock weren't exactly thriving either.


What could have led the once giving soil to forsake the grasses and poison the dock? Excess soil nitrate.
A few months later when the soil
moisture starts to evaproate you
can really see the salts being
left behind


We're all about minimizing water use in my house and a housemate was stepping outside to relieve himself in the night in the exact same spot.  It's right next to the stairs out of the house so it was certainly the most convenient location in the yard.


The urea from the urine was converted to ammonium, then to nitrite and finally to nitrate by soil bacteria. The higher level of salts in the soil (a salt being any ionic compound) due to all the nitrate probably made it pretty hard for the plants to access water. The excess nitrate was also probably toxic for plant growth.  So essentially what we're looking at is urea poisoning the soil biology and plant life in these patches.  

After this year's pathetic winter rains subsided and the soil started to dry out, evaporation and capillary action brought water to the surface of the soil where it evaporated into the air.  The nitrate salts that were dissolved in this water were then left at the soil surface.  You can see where the salt accumulation has left the soil slightly white in these pictures taken a few months later.

This is a visual manifestation of research which show that urea can increase soil acidity and salinity.  Here's one such study from Zhejiang University in China.

Now you might be saying, hold on, there's more to my urine than just urea.  There is indeed, and the wonderful, "Composotion and Concetrative Properties of Human Urine" prepared for NASA, has a great table on page 51 which lists these goodies by concentration.  Urea is the largest constituent of urine, making up 36% on average of its total solutes.  Inorganic salts such as sodium chloride, potassium chloride and potassium sulfate make up 38% altogether.  So the salt accumulation on the surface of this soil can't be blamed solely on urea.

I myself got in on the act of free urea applications on my blueberries - they wouldn't mind a little soil acidification after all.  You can see again the accumulation of salts on the soil surface:


I just have automatic drip set up on these plants so there is never thorough surface irrigation to flush all these salts down through the soil.

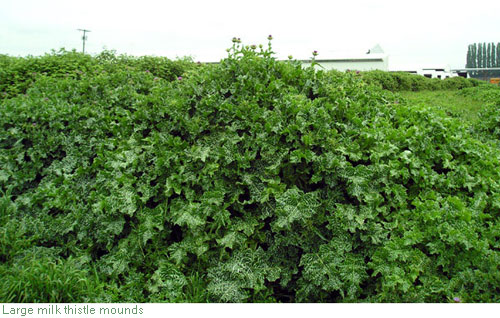
While we're on the topic, another soil/urine mystery was recently explained to me.  One spring day, walking by a  cabin where someone had lived for the previous six months, I noticed an isolated patch of thriving milk thistle (Silybum marianum).  This cabin had no toilet and the thisle patch was very close to his door step.  This must have been where he relieved himself each night, but I never understood why the thistles thrived in those conditions.  You could also see the milk thistles growing well on the downslope side of compost piles where the leachate would probably accumulate.  I was able to go to an Elaine Ingham talk a few months ago (mind blowing!) and I had a chance to query her about this.  Apparently thistles do best in soils with 50 ppm nitrate.  So they absolutely love to grow in a cherished pee spot.  Interestingly, milk thistle will also accumulate high levels of nitrate and this can be toxic to livestock.

Here are some pictures from the King County, WA, noxious weed website.  I definitely appreciate the enthusiasm over milk thistle here!

Note that the common theme among these pictures is that they're all on dairies where the cows are probably raising the soil nitrate levels a fair amount.


All this is not to say that urine is bad for the soil.  On the contrary, it is an amazing fertilizer, it just has to be used properly. It's hard to think of another well rounded fertilizer which is as easily accessible. If you are metabolizing protein, good news, there will be lots of urea in your urine along with bonus ionic compounds that will deliver potassium, magnesium, calcium and phosphate to the soil. 


Monday, January 26, 2015

The Global Food Market, Political Instability, and Fertilizers

In a globalized world, we all buy our food off the same market. The supply and demand of our world's food stocks dictate the price of food from New York to Sidi Bouzid.  This can be a good thing.  If crops fail in country A, food can still be purchased on the world market from other countries.  The global food market can also be a bad thing.  If country A depends on imported food and then one day countries B, C, D, and E are willing to pay twice as much for this food, the inhabitants of country A better hope they or their government can pony up the extra cash. The following graph from The Economist illustrates just how much of the world is not able to feed themselves without imports.


Even worse than being unable to afford food imports is when a country is actually producing enough food for its inhabitants but because the global market reaches everywhere, the food is exported to places where people are willing to pay higher prices.

The Irish Famine of 1845-49 is a classic example of this scenario. From Ireland's Great Hunger Museum comes this quote:

"'Although the potato crop failed, the country was still producing and exporting more than enough grain crops to feed the population. But that was a “money crop” and not a “food crop” and could not be interfered with.' Up to 75 percent of Irish soil was devoted to wheat, oats, barley and other crops that were grown for export and shipped abroad while the people starved."

To give you an idea of the level of this injustice, here are a few stats about the amount food leaving Ireland. In the first nine months of 1847, a year when over 400,000 Irish starved, 822,681 gallons of butter were shipped to England.  Even more outrageous is the 1,336,220 gallons of grain derived alcohol that were exported during this same 9 month period.

This phenomenon of food exports from hungry regions of the world happens to this day.  A clip from the great movie, Darwin's Nightmare, illustrates the point quite well: http://www.youtube.com/watch?v=reEctoUYW9E&t=2m43s

It's safe to say that the global food market dictates how most people eat.  Sometimes price surges in the market make it exceedingly hard for people to access food.  When people are unable to feed themselves, social unrest often follows.


This graph is from the article Freedom to Riot - On the Evolution of Collective Violence.  It uses data from the book Social Unrest and Popular Protest in England, 1740-1840 by John Archer.  It shows that major outbreaks of social unrest coincide with increases in the price of wheat.  The Y axis should actually read "Average Price of Wheat in Shillings in England and Wales" based on the data. Red lines indicate years with major outbreaks of rioting.  Although these price fluctuations probably had less to do with the global food market of the time period, the graph does show how social unrest and high food prices are related.

Food price spikes and unrest

This next graph is from the now well known paper of the New England Complex Systems Institute, The Food Crises and Political Instability in North Africa and the Middle East.
The dotted red lines indicate the outbreak of food riots and social unrest.  The inset is a graph of the FAO food price index since 1990.  The implication of this graph is that high global food prices helped spark the Arab Spring.  If we recall the first chart from The Economist, the Middle East and Africa are heavily reliant on food imports.  Spikes in global food prices therefore put a lot of strain on this region.  For a more detailed analysis of how declining agricultural production in the midst of the 2011 price increase helped spark the Syrian civil war, check out this older post.

How do fertilizers play into this?  From the graph below it's clear that fertilizer prices spike at the same time as the dramatic increases in the global food prices in 2008 and 2011.   The following graphs were made on Knoema.com using World Bank Commodity Price Data.

The increase in fertilizer prices in 2008 was due to a lot of different factors.

Economic growth in developing countries during this period was accompanied by increased demand for meat and other animal products.  The increased livestock production needed to support this diet requires a lot of grain, and this increase in demand for grains in turn led to more demand for fertilizers.  Subsidized biofuels pushed grain demand even further.  In 2007, 18-20% of all corn grown in the US was used for ethanol.

With the demand for grains and other foods pushing food prices up, farmers in developed countries responded by applying more fertilizer in order to increase yields and profit.  There are diminishing returns on increased fertilizer application, but when corn was at a record high of $6.12 a bushel in 2007, the marginal extra yields from more fertilizer would cover costs and then some.

In the midst of this rise in fertilizer prices, China placed high tariffs on the export of fertilizers.  At the time, China was the world's second largest exporter of phosphorus and the largest exporter of urea.  This was certainly a good move for Chinese farmers as it protected them from the price surge on the global market, but it drove prices for the rest of the world even higher.

Knowing how important easy access to fertilizers is for political stability, numerous countries subsidize fertilizer costs.  This is the case in India, and as detailed in an earlier post, in Malawi.  When fertilizer costs increase, these governments are forced to dig deep into their pockets in order to continue the programs.  The upshot of this is that farmers in these countries do not respond to price increases by using less fertilizer as they still pay the subsidized amount.  Consequently the global market for fertilizers stays high as there is no let up in demand in these countries.

Energy prices also play an enormous role in the fluctuating cost of fertilizers. Synthetic nitrogen production requires 2-3% of the global natural gas supply.  Energy costs were very high in 2007-2008 which of course pushed N fertilizer prices higher.

This is not the only time energy prices have pushed up the price of fertilizers and food.  The graph below charts the food and fertilizer price indices from 1960.  It's possible to see how the 1973 and 1979 oil crises affected both the cost of food and fertilizer.


Eventually, the record breaking fertilizer spike of 2008 subsided.  Farmers were simply unwilling or unable to pay such high prices and fertilizer use decreased.  A similar spike happened again in 2011 along with a more sustained increase in food prices.

There are so many factors at play in the volatile global markets for food and fertilizers.  It's not possible to simply point to rising fertilizer prices as the cause of rising food prices when there are several other important drivers for the supply and demand of global food stocks.  Even with these other factors, there is a definite link between fertilizer prices and food prices. It's very hard to have cheap food when fertilizer is expensive.

Fertilizer price volatility hurts poorer farmers the most. When fertilizer doubles in price a lot of these farmers simply cannot afford to buy fertilizer and consequently produce much less food for themselves and local populations.  When this is combined with an increase in food prices on the global market, these populations have a very hard time accessing food as both domestic and imported sources are expensive.

Because of the dramatic '08 spike in the fertilizer index on the graph above, the food price index spike may not seem that bad. Indeed, for citizens of the US, who pay less on food than anyone else in the world, a mere 6.8% of annual income, the food crises of '08 and '11 were not a big problem.  Say that you lived in Algeria though. You're making the average yearly income of about $4000 USD.  In the fall of 2006 you paid $887 a year on food for your family.  By June of 2008 it would require $1,752 to buy the same food.  Unless you managed to substantially increase your income in that short time period, you're really hurting.  To make the example even clearer, the Algerian situation can be put in terms of a US salary.  If you're making $50,000 annually, in 2006 you would be spending $11,118 on food.  By the food spike of 2011 you're now spending $22,405 on food.  If this happened to consumers in the US one can imagine how angry and unstable the political landscape would become. We have a relatively well functioning democracy which helps to manage the displeasure of our populace. During the food price surge of 2011, there was no political outlet for the enormous frustration that built up under the autocratic regimes of the Middle East.  Within a year the Arab Spring would topple many of these governments:


I think the take away from this is that there is a very real link between political stability and the global food price index for countries that import much of their food. Furthermore, volatility in the fertilizer market contributes to high food prices.  To avoid political problems stemming from dramatic food and fertilizer price increases, domestic self sufficiency in both food production and fertility needs is critical.  The political will to set export tariffs on these products to prevent food/fertility from leaving the country in times of scarcity is another important part of maintaining stability.  Certainly, becoming self-sufficient in food and fertility needs is not something that happens over night, but if the food crises of 2008 and 2011 are a phenomenon that will happen again, countries would do well to start working towards these goals now.


For further reading about the 2008 fertilizer price spike here are a few articles that offer different levels of analysis:

World fertilizer prices drop dramatically after soaring to all-time highs

Factors Contributing to the Recent Increase in U.S. Fertilizer Prices, 2002-08

World fertilizer prices surge 200% in 2007


Wednesday, December 24, 2014

Vegetable garden animated GIFs!

I finally got around to making time lapsed gifs from the photos I took in the vegetable garden last spring.

Here is the side yard with squash, beans and leeks on the right and leeks and brassicas on the left. You can see the weeds are mercifully spared as the season goes on.


This is corn in the front yard.  The front variety is a popcorn and in back is Oaxacan green dent corn. The popcorn didn't grow as tall as the plants I saved the seed from but it still made some good ears.


Here is the backyard squash and tomato patch.  Some Jerusalem artichokes pop up into the frame in mid June.  You can also see some lettuce bolting just below.


I wanted to see a zucchini progressing from flower to harvest.  The first zucchini I started taking photos of got blossom end rot though.  It turned out to be a great opportunity to watch the blossom end rot process - from hopeful flower to rotten mush.  On the 7th and 8th days after the flower has closed, the end of the zucchini becomes very very faintly yellow.  Then on the 9th day it turns a striking yellow.  Each day after that the zucchini slowly rots, with a new segment rotting each day.  I tried to figure out what made the demarcation of each segment.  Was it that the rotting happened at night and stopped during the day?  Did it have to do with when I watered?  I couldn't piece it back together.  Blossom end rot happens when the fruit does not get enough calcium.  The calcium in that part of the garden though is absolutely over the top- 6754 ppm and an 82% calcium base saturation in one half of the back yard and then 5064 ppm and 69% calcium base saturation in the other half. I think what probably happened is the plants were still young at this point and I may not have been doing a great job watering the garden. (It was a big job hand watering it every day -I installed drip irrigation for this season though!)  If the soil dried out a little bit the plant might not have been able access calcium as easily as calcium enters the plants roots passively with water.   This area also tested rather high for phosphorus, 94 ppm (6.9 pH) and 163 ppm (6.6pH)!  Perhaps the calcium was locked up in slightly insoluble calcium phosphate?  I didn't see too many blossom end rot problems after the first few squash though so I think it was just a water issue.


Here's that same video slowed down starting on the 7th day after the flower closed when the zucchini just barely starts to yellow.


Lastly here's a zucchini growing like it's supposed to.


Monday, December 22, 2014

Where do we come from?

The human body is a rather complex operation.  Multiple organ systems lumbering around in a mobile casing which is home to billions of different organisms.  This intricate being is constructed using combinations of chemical elements, the building blocks of our universe.  Eleven different chemical elements make up 99.9% of the mass of a human.    So what is the source for these elements that we must absorb in order to become who we are?  For a great many of these elements it is the soil.

While volunteering for a soils education exhibit, I accosted an unfortunate visitor or two and asked them where the magnesium in their bodies came from.  Interrogating strangers on where they get their nutrients from can feel wierd. It seemed a poster with pictures would be a better way to illustrate the fact that magnesium in our bodies comes from the soil.  So then, to answer all your deep questions as to your origins:


The poster is also the work of one Jessi Barber who works for the education exhibit.  She was kind enough to replace all the photos I had just grabbed off the internet with photos her organization had taken.  She also fixed the text so it was a little more to the point.

Of the elements humans need to live, Oxygen, Carbon, and Hydrogen make up 96% of our bodies.  Nitrogen makes up another 3% which shows why it is such an important fertilizer.  Yet just because other elements represent a smaller fraction of our mass does not mean they our less important.  A human without any Phosphorus will be just as non-existent as a human without Carbon.  

We get 12 of the 18 core elements we need to survive from the soil via plants and animals we eat.  Carbon, the second most abundant elements in our bodies comes from plants and animals we eat, but the source of this carbon is from the air.  Plants photosynthesize carbon dioxide and water to form sugar and then more complex carbohydrates.  

Here are the primary sources of the 18 core elements that compose our body, in order of abundance by mass:

Oxygen - From water we drink and air we breathe
Carbon - From plants which take it out of the air as carbon dioxide
Hydrogen - From water we drink
Nitrogen - From plants which uptake it from SOIL
Calcium - From plants which uptake it from SOIL
Phosphorus - From plants which uptake it from SOIL
Sulfur - From plants which uptake it from SOIL
Potassium - From plants which uptake it from SOIL
Sodium - From salt
Chlorine - From salt
Magnesium - From plants which uptake it from SOIL
Iron - From plants which uptake it from SOIL
Zinc - From plants which uptake it from SOIL
Copper - From plants which uptake it from SOIL
Selenium - From plants which uptake it from SOIL
Manganese - From plants which uptake it from SOIL
Iodine - From iodized salt and sometimes from plants via soil
Molybdenum - From plants which uptake it from SOIL

Whenever plants are harvested, the elements they have absorbed into their tissues are removed from the soil on which they were grown.  These elements must be replaced in the form of fertilizers or compost otherwise the soil will become deficient in the these elements and plant growth will suffer.  Capturing these soil nutrients in our waste streams (like when we compost) is an important way to help maintain the soil fertility of our farmland.

Originally I had written, "The human body cannot survive without 16 key elements".  With this wording you're still in the right if somebody wants to tack on Bromine, Cobalt, Nickel and some other trace elements to this list.  The important thing is to not say, "The human body needs 16 elements to live, no more, no less." I've changed the poster a little to reflect 18 core elements as discussed in this blog post. If we include elements the body will use in extremely trace amounts, 36 elements have been found to play a positive role in human health. I'm sure that number will differ depending on what authority you ask and will fluctuate as new research comes out.

Even something pretty far off our radar such as Rubidium is important for the health of humans....or at least the health of "she goats": Recent progress in exploring the essentiality of the ultratrace element rubidium to the nutrition of animals and man.  Whether or not the body could survive without some of these elements and simply live in poorer health is another question.  If you want to know more about the elements required for human life check out Chapter 16. Ultratrace Minerals in Modern Nutrition in Health and Disease or the wikipedia page, Composition of the Human Body

The number of elements actually found in the human body is usually 42. For a detailed list see this table: Estimated Atomic Composition of the Lean 70-kg Male Human Body. (Somewhat worrisome for the credibility of this source is that they say there are normally 41 elements present and then list 42!)  

Thankfully, if we have access to whole foods grown on fertile soils, we rarely have to think about the amount of specific elements are bodies are recieving.  

Monday, December 15, 2014

Attack of the Killer Bunya Pines

I was in Aquatic Park the other day when I saw this gem:


The tree is Araucaria bidwillii, otherwise known as a bunya pine.  The tree produces male pollen cones and female seed cones.  The female seed cones can get up to a foot in diameter.  In the fall Araucaria bidwillii apparently uses the seed cones to crush hapless passersby.

A denizen of San Francisco on their smart phone, unaware they just narrowly survived an encounter with the killer Araucaria bidwillii